Monday, September 16, 2013

Add Hyperlinks

Hyperlinks allow you to access documents or web pages related to features.


Step 1, 

In the Attribute table provide some URLs, Scripts, Documents you need..


Step 2,

Right click on the layer -- Properties -- Display -- Hyperlinks -- Tick on the "Support Hyperlinks using fields ". the select either Document, URL or Script.

If you select document in your field you have to give the path to you document ex - F:\Blog Image\Hyperlink
If you select URL then you have to give the URL's
 If you choose to use a script, use the Edit button to write your script using JScript or VBScript.


Step 3,

Select the field you have given the URL's, Documents paths....


 Step 4,

Then select Hyperlink Button,


 Step 5,

You can see the hyperlinks, and just click on the desired place, it will direct you to given URL or Documents...


Tuesday, May 21, 2013

Spatial Selection


Select by Location in ArcGIS


In ArcGIS we can use Spatial selection to select features which are related to another layer, as a example in the province layer what are the cities effect by the highway road,  try following example,

Step 1,
Add city or province layer you want to select,


Step 2, 
Add another layer you need to intercept, (here I'm using a road layer)


Step 3,
Then in the tool bar select "Selection" tool, and select "Select by Location", 


Step 4,
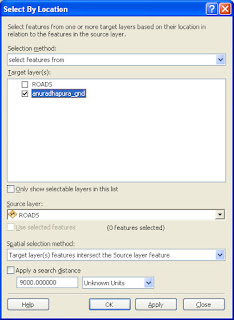
Then in "Selection Method" select "Select Features From" option, then in the "Target Layer(s)" you have to select layer you need to get the out put, for this example I have selected "Anuradhapura_gnd", then for the "Source Layer" you have to select next layer using for this operation, 

Step 5, 
finally in the "Spatial Selection Method" we have to select " Target Layer(s) features Intersect the Source Layers features" (normally it is the first option to be select) then "apply" and "ok"


Step 6, 
You can see now it has been selected intersect features,  


Step 7,
If you open the attribute table you can check the selected data, 


Step 8,
If you need to export selected data as a shape file you can follow below steps,


Sunday, May 5, 2013

Thematic Mapping / Symbology


                                     Thematic Mapping


In previous post we have given different colors to the different polygons, here we are doing something like same but here we are doing  analytic process, so this maps can be use for analytic tasks, 

Step 1 , 

  
Just add a your shape file in to layer

Step 2,


Then "right click" on the layer and go to properties then select "Symbology" tab.

Step 3,


Then select "Graduated Colors" under "Quantities".

Step 4, 


After that from "Value" select field you need, I have select "Male" filed for this task.

Step 5,


from "Classification" we can select how many breaks we need (number of range), 

Step 6, 


Then from the "Color Ramp" select color range you required. 

Step 7,


Then you can see the result by just click on "Apply" and "ok". Left hand side you can see the ranges and the colors as we given.


Monday, April 29, 2013

Attribute Table in ArcMap


                                    Attribute Table


For each and every project we are doing by using ArcMap we can create a database to record the data. to day we are going to get familiar  with the attribute table available with the ArcMap 10. The attribute table which I'am using already created and having some data.

Step 1,

Add shape file to the layer (make sure your shape file is containing at-least few records...), then right click on the layer and select "Open Attribute Table",


Step 2,

Now you can see the data stored in the Attribute table, then select "Select By Attribute" option as below,


Step 3,

You can see now all the fields in your Attribute table has taken to this table for selection, this is actually very simple kind of a query writing(just like SQL), Do not have to worry even you don't have enough knowledge about   writing query  ArcMap 10 provided you all the facility to write query with minimum basic knowledge  first of all select filed you need as example given below, 


Step 4, 

Simply double click on the required field, the it will be taken to query as below, and then select      " = " sign since we are gong to select particular name from the selected field (from "DSD_N" as in this example).

note - In here not only the "=" sign, you can use everything which available with the ArcMap10. 


Step 5,

Now you can understand that we are going to select what we need from our shape file, also you can see half of our query have written, now we have to select what is the name of the attribute we are going to select, for that you have to select "Get Unique Values" tabs, then you will be able to see your requested data set.


                                             (just double click on the field name you need)


Step 6,

Then just click "Apply" to run the query, and it will filter and select the required data as below, 


                      (to see only the selected data you can click on button as i shown in above image)

Step 7,

Your Selected data will also be appear in the map also, 


Labels in ArcMap

                                        Labels 


In my previous post I have done how to use symbology tool in the ArcMap 10. So to day we are going to give Labels for the polygons, If u need go through my previous post and refresh your memory....


Step 1,

First of all you have to add shape file to a layer which contain at-least few polygons. (better to use your previous example), then go to properties,


Step 2,

Then select "Label" tab,


Step 3,

Then tick on the "Label feature" and then in the "Label field" select the field you need to add labels.. 

Step 4,

Now you can see labels appear in the polygon, make sure in the attribute table you have add names properly . 


Symbology


To day we are going to give different colors for the polygons which are in same Shape file,

Step 1 ,

Add a shape file to ArcMap which containing at least few polygons. 


Step 2,

Then right click on the Shape file and select the properties,


Step 3,

Now you can see the property window, then select Symbology tab, and select Unique Value under Categories,


Step 4,

Then from the Value Filed you can select the filed you want to work with Symbology,


Step 5,

Then you have to select "Add All Values", then in the pop up window select "Yes" button, 


Step 6,

Now you can see ArcMap has been added the polygons you have requested,


Step 7,


You can select color scheme as you wish by using "Color Ramp",


Step 8,

Finally just select "Apply" and "Ok", you will see your work as below,


Monday, November 19, 2012

BUFFERING - Geo-Processing

BUFFERING 


  Zone of a specified distance around features. Buffers are useful for proximity analysis. 

 Now we are going to do a simple  task by using buffering, we are going to determine which areas in Colombo city are effected by mosquito, for this we need a assumption, therefore we will assume 250 meters around the breeding points effected by mosquito. (for this we need the breeding points of Colombo city, but you can use what ever data you have as your requirements, )

Steps -

1. Launch the ArcMap, normally in the Arcmap it does not automatically assign a units for the layer, for the Buffer projects it is better to use meters or you can use as your requirements. Therefore right-click on the Layers go to properties, then click the General tab and then set both Map units and Display units to Meters.


2. add data layer you are going to use,


3. Now we have to add the "Buffer Wizard Tool" for ArcMap tool bar. therefore go to
Customize > Customize mode > Command Tab > Tools > Buffer Wizard
then drag the wizard and drop in to any tool bar you like,  


4. Now we have to open the "Buffer Wizard" and then select "Breeding Point" as the feature of  a layer.


5.  Then assign the value for the "At a specified distance" as 250 m, make sure you have select units as meters,


 6. then next step follow as I have shown below,


7. Now you can see the your final result .

8. If you need you can add a colombo city layer, colombo road layer or what ever layer you need and then you can easily do the proximity analysis.